
[:en]
JMP Pro is the advanced analytics version of JMP, created for power users who need sophisticated modeling techniques to better anticipate the future and plan well for tomorrow. Built with scientists and engineers in mind, JMP Pro statistical analysis software from SAS provides all the superior capa¬bilities for interactive data visualization, exploration, analysis and communication that are the hallmarks of JMP.
In addition, JMP Pro offers a multitude of sophisticated techniques: predictive modeling with cross-validation using a number of different methods, modern modeling techniques, model compari¬son and averaging features, advanced multivariate techniques, reliability block diagrams, covering arrays, mixed models, uplift models and advanced computational statistics methods.
Having access to all the rich advanced analytics in JMP Pro removes road¬blocks to statistical discovery and enhances your ability to uncover more clues in your data. Therefore, you make breakthroughs more quickly, enabling you to become more proactive and take greater control of the future.
JMP Pro statistical discovery software from SAS is built for analytics power users like you.
Challenges
Many organizations rely on “A-B testing” for experimental design, but testing one situation against another with many factors in flux is a very slow way to learn about your business.
In contrast, design of experiments (DOE) in JMP offers a proven and practical approach for exploring and exploiting the multifactor opportunities that exist in almost all real-world situations. Using multifactor experiments, you learn more quickly, at minimal cost, by teasing out not just the effect of an individual factor, but also the combined impact of two or more factors. JMP offers leading-edge capabilities for design of experiments, so you can design the best experiments to answer specific questions. JMP also offers a rich set of analyses tailored to your design in a form you can easily use.
Instead of fitting your problem to a textbook design, you fit the design to your problem with the budget you have. The unique Custom Designer constructs an optimal design for your problem, taking into account specific conditions such as time, budget and other experimental constraints.
Once you have completed your sophisticated analyses, employing basic tools for visual analysis is often the best way to communicate results and motivate action. The interactivity of JMP gives you the tools to share the meaning in graphs and not just the graphs themselves.
The market demands continual improvement, which is why you strive to accelerate time to market, protect your brand by minimizing customer complaints, and deliver products and services that consistently meet or exceed customer expectations. JMP has the necessary tools to be at the heart of your quality program, providing a wide range of relevant graphical and statistical capabilities.
The JMP® Solution
It’s easier to work productively if you can configure your software to work the way you think. Consistent settings, graph output and even color palettes mean fewer steps to understanding data. JMP gives you a comprehensive set of preferences that enable you to control fonts, graphic options and detailed settings within platforms. It’s analysis the way you like it. You can even choose to display only those analytic tools and menus you use routinely. In fact, you can customize every aspect of JMP, including:
- Graph axis settings, styles, graphs and colors.
- Statistical and graphical elements presented in a JMP report.
- Import settings that can be predefined to take in new data in a form you can use immediately.
- Your environment for scripting and application development.
As a member of the SAS family, JMP offers a seamless interface to the unparalleled capabilities of SAS. The deep analytics, reporting and data management capabilities of SAS extend capabilities of JMP desktop software to the server and beyond. You can also use JMP with other analytic tools, including a full interface to the power of MATLAB, complete calling interface to DLLs and the rich set of specialized libraries in R. JMP makes it easy to reach out to these resources and bring back results for dynamic data visualization and analysis. Or you can seamlessly integrate an algorithm or function into the JMP workflow, making SAS, MATLAB or R feel like part of JMP.
Benefits
Predictive modeling
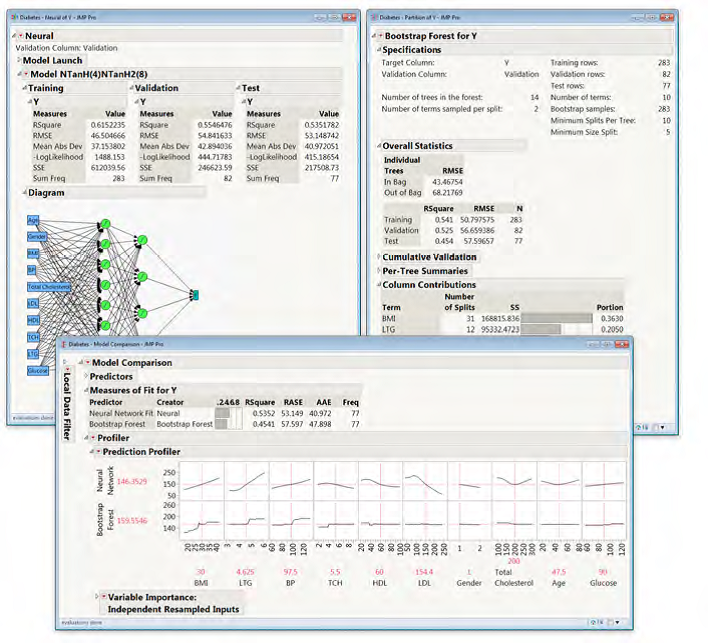
At the heart of data mining are the advanced tools to fit large models that generalize well with new data. JMP Pro includes a rich set of algorithms for building better models with your data. Two of the most useful techniques for predictive modeling are decision trees and neural networks.
The Partition platform in JMP Pro automates the tree-building process with modern methods. The bootstrap forest, a random-forest technique, grows dozens of decision trees using random subsets of the data and candidate variables, and then averages these trees. The boosted tree technique builds many simple trees, repeatedly fitting the residuals from the previous tree. The Partition platform in JMP Pro also fits K nearest neighbors (K-NN) models. Using these methods lets you build models that often predict better than simple decision tree models.
The advanced Neural platform in JMP Pro lets you build one- or two-layer neural networks with your choice of three activation functions and also provides automatic model construction using gradient boosting. This platform automatically handles missing values and transformation of continuous X’s, which saves time and effort. In addition, it includes robust fitting options.
Both the Partition and Neural platforms in JMP Pro take advantage of using cross-validation. The purpose of validation is described in the next section. In addition, stepwise regression, logistic regression (both nominal and ordinal) and discriminant analysis in JMP Pro support the use of a validation column.
Cross-validation
For effective predictive modeling, you need sound ways to validate your model, and with a large model, you can easily get into trouble over-fitting. Large models should always be cross-validated, and JMP Pro does this through data partitioning, or holdback. Dividing the data into training, validation and test data sets has long been used to avoid over-fitting, ensuring that the models you build are not reliant on the properties of the specific sample used to build them.
The general approach to cross-validation in JMP Pro is to use a validation column. You can easily split your data into different sets for different purposes using the validation column utility (either with a purely random sample or stratified random). The training set is used to build the model(s). The validation set is used in the model-building process to help choose how complex the model should be. Finally, the test set is held out completely from the model-building process and used to assess the quality of the model(s). For smaller data sets, k-fold cross-validation also can be used in some platforms.
Cross-validation helps you build models that generalize well to tomorrow’s data – about new customers, new processes or new risks – so you can make data-driven inferences.
Model comparison
In the real world, some kinds of models fit well in certain situations but fit poorly in others. With JMP Pro, there are many ways to fit, and you need to find out which one is most appropriate in a given situation. A typical approach to model building is that you will try many different models: models with more or less complexity, models with or without certain factors/predictors, models built using different kinds of modeling methods, or even averages of multiple models (ensemble models).
Each of these models will have common quality measures that can be used to assess the model: R2, misclassification rate, ROC curves, AUC, lift curves, etc.
Using model comparison in JMP Pro, you can compare all the saved prediction columns from various fits and pick the best combination of goodness of fit, parsimony and cross-validation. JMP Pro makes this comparison automatically. At the same time, you can interact with visual model profilers to see which important factors each model is picking up. Model comparison in JMP Pro makes it easy to compare multiple models at the same time, and also to do model averaging, if desired.
Modern modeling
Generalized regression is a class of new modeling techniques well suited to building better models, even with challenging data. It fits generalized linear models using regularized or penalized regression methods.
Standard estimation techniques break down when you have predictors that are strongly correlated or more predictors than observations. And when there are many correlated predictors (as is often the case in observational data), stepwise regression or other standard techniques can yield unsatisfactory results. Such models are often over-fit and generalize poorly to new data.
But how do you decide which variables to cull before modeling – or, worse, how much time do you lose manually preprocessing data sets in preparation for modeling?
Generalized regression is a complete modeling framework. It takes you from variable selection through model diagnostics to LS means comparisons, inverse prediction and profiling. And it’s only in JMP Pro.
The regularization techniques available within the Generalized Regression personality include Ridge, Lasso, adaptive Lasso, Elastic Net and the adaptive Elastic Net to help better identify X’s that may have explanatory power. Harnessing these techniques is as easy as any other modeling personality in Fit Model – simply identify your response, construct model effects and pick the desired estimation and validation method. JMP automatically fits your data, performs variable selection when appropriate, and builds a predictive model that can be generalized to new data. You can also use a forward stepwise technique, perform quantile regression or simple fit using maximum likelihood.
Finally, Generalized Regression gives options to choose the appropriate distribution for the response you are modeling, letting you model more diverse responses such as counts, data with many outliers, or skewed data.
Advanced multivariate techniques
JMP Pro includes several advanced techniques to build better models when faced with data problems that require multivariate fitting methods.Partial least squares. Are you trying to model data that is wider than it is tall? Traditional techniques won’t work, but partial least squares (PLS) does. PLS is a powerful modeling technique to have in your toolbox, especially when you have more X variables than observations, highly correlated X variables, a large number of X variables, or several Y variables and many X variables. All of these are situations where ordinary least squares would produce unsatisfactory results.
PLS modeling fits linear models based on factors, namely, linear combinations of explanatory variables (the X’s). The factors are obtained in a way that attempts to maximize the covariance between the X’s and the response or responses (the Y’s). In JMP Pro, you can build PLS models with either continuous or categorical responses (PLS-DA), specify curvature terms or interaction effects and perform missing value imputation.
Variable clustering.
When presented with a large number of variables to predict an outcome, you may want to reduce the number of variables in some way to make the prediction problem easier to tackle. One possible dimension reduction technique is the well-known method of principal components analysis (PCA). The variables resulting from PCA, however, can be hard to interpret.
An alternative strategy is to use variable clustering in JMP Pro to help you to understand whether your responses are grouped into clusters and to determine how many clusters the responses contain. Selecting any cluster within the report automatically selects the cluster’s most representative column in the data table, making it much faster and easier to specify model terms or perform dimension reduction.
Reliability Block Diagram
Often, you are faced with analyzing the reliability of a more complex analytical system – a RAID storage array with multiple hard drives, or an airplane with four engines, for example. With JMP, you have many tools to analyze the reliability of single components within those systems. But with JMP Pro, you can take the reliability of single components, build a complex system of multiple components and analyze the reliability of an entire system with the Reliability Block Diagram platform.
This platform allows you to better predict the reliability of the whole system and determine the expected performance based on the current performance of individual components. You can easily perform what-if analyses by looking at different designs and comparing plots across multiple system designs. You can also determine the best places to add redundancy and decrease the probability of a system failure. Using the Reliability Block Diagram, you can easily design and fix weak spots in your system – and be better informed to prevent future system failures.
Covering arrays
Covering arrays are used in testing applications where factor interactions may lead to failures. Each experimental run may be costly. As a result, you need to design an experiment to maximize the probability of finding defects while also minimizing cost and time. Covering arrays let you do just that. JMP Pro lets you design an experiment to test deterministic systems and cover all possible combinations of factors up to a certain order.
And when there are combinations of factors that create implausible conditions, you can use the interactive Disallowed Combinations filter to automatically exclude these combinations of factor settings from the design.
One of the huge advantages of covering arrays in JMP Pro is that JMP Pro is a statistical analysis tool, not just a covering arrays design tool. You can do all sorts of statistical analyses in JMP Pro. For example, there is currently no other software for covering arrays design that also lets you analyze your data using generalized regression.
JMP Pro also allows you to import any covering array design – generated by any software – and further optimize it and analyze the results. You can design the arrays yourself without having to rely on others to build experiments for you. Test smarter with covering arrays in JMP Pro.
Mixed models
Mixed models let you analyze data that involves both time and space. For example, you might use mixed models in a study design where multiple subjects are measured at multiple times during the course of a drug trial, or in crossover designs in the pharmaceutical, manufacturing or chemical industries.
JMP Pro lets you fit mixed models to your data, letting you specify fixed, random and repeated effects; correlate groups of variables; and set up subject and continuous effects – all with an intuitive drag-and-drop interface.
In addition, you can calculate the covariance parameters for a wide variety of correlation structures. Such examples include when the experimental units on which the data is measured can be grouped into clusters, and the data from a common cluster is correlated. Another example is when repeated measurements are taken on the same experimental unit, and these repeated measurements are correlated or exhibit variability that changes.
It is also easy to visually determine which, if any, spatial covariance structure is appropriate to utilize in your model specification when building mixed models in JMP Pro.
Uplift models
You may want to maximize the impact of your limited marketing budget by sending offers only to individuals who are likely to respond favorably. But that task may seem daunting, especially when you have large data sets and many possible behavioral or demographic predictors. However, with JMP Pro, you can use uplift models to make this prediction. Also known as incremental modeling, true lift modeling or net modeling, this method has been developed to help optimize marketing decisions, define personalized medicine protocols or, more generally, to identify characteristics of individuals who are likely to respond to some action.
Uplift modeling in JMP Pro fits partition models that find splits to maximize a treatment difference. The models help identify groups of individuals who are most likely to respond favorably to an action; they help to lead to efficient and targeted decisions that optimize resource allocation and impact on the individual.
Advanced computational statistics
JMP Pro includes exact statistical tests for contingency tables and exact non-parametric statistical tests for one-way ANOVA. Also, JMP Pro includes a general method for bootstrapping statistics in most JMP reports.
Bootstrapping approximates the sampling distribution of a statistic. JMP Pro is the only statistical software package that lets you bootstrap a statistic without writing a single line of code. One-click bootstrapping means you are only a click away from being able to bootstrap any quantity in a JMP report.
This technique is useful when textbook assumptions are in question or don’t exist. For example, try applying bootstrapping techniques to nonlinear model results that are being used to make predictions or determining coverage intervals around quantiles. Also, you can use bootstrapping as an alternative way to gauge the uncertainty in predictive models. Bootstrapping lets you assess the confidence in your estimates with fewer assumptions – and one-click bootstrapping in JMP Pro makes it easy.
Connect to the richness of SAS®
As one of the SAS offerings for predictive analytics and data mining,
JMP Pro easily connects to SAS, expanding options and giving access to the unparalleled depth of SAS Analytics and data integration. With or without an active SAS connection, JMP Pro can output SAS code to score new data quickly and easily with models built in JMP.
Share and communicate results.
JMP has always been about discovery and finding the best way of communicating those discoveries across your organization. JMP Pro includes all the visual and interactive features of JMP,making your data accessible in ways you might never have experienced. Through dynamically linked data, graphics and statistics, JMP Pro brings your investigation alive in a 3-D plot or an animated graph showing change over time, generating valuable new insights that inform both the model-building and explanation process.
Core Capabilities
JMP Pro includes all of the features in JMP, plus the additional capabilities for advanced analytics listed below.
Predictive Modeling
Classification and regression trees (partition modeling)*
Bootstrap forest, a random-forest technique.
Boosted trees.
K-nearest neighbors prediction (K-NN).
Support for validation column.
Neural network modeling
Automated handling of missing data.
Automatic selection of the number of hidden units using gradient boosting.
Fit both one- and two-layer neural networks.
Automated transformation of input variables.
Three activation functions (Hyperbolic Tangent, Linear, Gaussian).
Save randomly generated cross-validation columns.
Save transformed covariates.
Support for validation column.
Stepwise regression
Support for validation column.
Logistic regression (nominal and ordinal)
Support for validation column.
Discriminant analysis
Support for validation column.
Standard Least Squares
Support for validation column.
Cross-Validation
General approach using validation column and validation role in modeling platform launch dialogs.
Validation Column Utility
Automatic partitioning of data into training, validation and test portions; creation of validation columns.
Purely random or stratified random methods to create the holdback sets.
Validation column creation from platform launch by clicking validation column role.
Model Comparison
Automatic comparison of models built using JMP Pro.
Profiler.
Fit statistics (R2, Misclassification Rate, ROC curves, AUC,
Lift Curves).
Model averaging.
Modern Modeling
Generalized regression
Regularization techniques: Ridge, Lasso, adaptive Lasso,
Elastic Net, adaptive Elastic Net.
Forward selection.
Quantile regression.
Normal, Cauchy, exponential, Gamma, Beta, binomial, Beta binomial, Poisson, negative binomial distribution.
Zero inflated binomial, Beta binomial, Poisson, negative binomial, Gamma distribution.
Choice of validation methods: Validation column, KFold, holdback, leave-one-out, BIC, AICc.
Advanced Multivariate Techniques
Partial least squares (PLS) modeling
PLS personality in Fit Model supports continuous or categorical response; continuous or categorical factors, interactions and polynomial terms.
NIPALS-style missing value imputation.
Save randomly generated cross-validation columns.
A Standardize X option, which centers and scales individual variables that are included in a polynomial effect prior to applying the centering and scaling options.
Choice of validation methods: Validation column, KFold, holdback, leave-one-out.
Principal component analysis (PCA)
Variable clustering in PCA.
Reliability Block Diagram
Build models of complex system reliability.
Use basic, serial, parallel, knot, and K out of N nodes to build systems.
Build nested designs using elements from design library.
Covering Arrays
Design and analyze covering arrays.
Optimize designs after they are created for further run reduction.
Use disallowed combinations filter to specify infeasible testing regions.
Import covering arrays created by other software; analyze coverage and optionally further optimize.
Mixed Models
Specify fixed, random and repeated effects.
Correlate groups of variables, set up subject and
continuous effects.
Choice of repeated covariance structure.
Variograms serve as a visual diagnostic to determine which, if any, spatial correlation structure is most appropriate.
Uplift Models
Decision tree method to identify the consumer segments most likely to respond favorably to an offer or treatment.
Incremental, true-lift, net modeling technique.
Support for validation column.
Advanced Computational Statistics
Oneway Analysis
Nonparametric exact tests.
Contingency Analysis
Exact measures of association.
General Bootstrapping
Bootstrap statistics in most reports in a single click.
About SAS
SAS is the leader in business analytics software and services, and the largest independent vendor in the business intelligence market. Through innovative solutions delivered within an integrated framework, SAS helps customers at more than 50,000 sites improve performance and deliver value by making better decisions faster. Since 1976 SAS has been giving customers around the world THE POWER TO KNOW®.
JMP® software is published by SAS Institute Inc. (www.sas.com).
[:]